RPS 50 Strong-Stock Ranking Weekly Report
This report lists the current strong targets in the four markets based on RPS 50 (relative price strength of 50 trading days). RPS is the historical relative performance ranking within the market, does not predict future prices, and does not constitute investment advice.
A-shares – RPS Leaders Top 20
From the RPS 50 ranking list of this week, the strong distribution of A-shares is mainly concentrated in pharmaceutical and biotechnology (6 stocks), manufacturing (3 stocks), and basic chemicals (3 stocks). Nearshore Protein and Wuzhou Medical are at the forefront, showing that funds still prefer directions with relatively higher relative strength. Before the trend is destroyed, continuously observe the diffusion degree and pullback support of leading sectors; if breadth contracts, then the chase price rhythm should be reduced.
| Ranking | Code | Name | Sector/Industry | RPS 50 | RPS 90 | RPS 120 | RPS 250 | RPS 20 | Today's Change |
|---|---|---|---|---|---|---|---|---|---|
| 1 | 688137 | Nearshore Protein | Pharmaceutical and Biotech | 100.0 | 100.0 | 99.9 | 99.8 | 100.0 | +7.45% |
| 2 | 301234 | Wuzhou Medical | Pharmaceutical and Biotech | 100.0 | 100.0 | 100.0 | 99.5 | 99.2 | -0.66% |
| 3 | 601579 | Kuaiji Mountain | Manufacturing | 100.0 | 99.8 | 99.5 | 95.5 | 99.9 | +1.72% |
| 4 | 002667 | * ST Wellington | Machinery | 99.9 | 93.2 | 71.2 | 93.9 | 96.8 | +0.86% |
| 5 | 600127 | Jinjian Rice Industry | Manufacturing | 99.9 | 99.9 | 99.4 | 97.6 | 97.0 | +10.00% |
| 6 | 301122 | Adoption OF shares | Pharmaceutical and Biotech | 99.9 | 99.9 | 99.6 | 98.4 | 99.5 | +1.41% |
| 7 | 600825 | Xinhua Media | Culture, Sports and Entertainment Industry | 99.9 | 99.8 | 99.6 | 95.7 | 100.0 | +10.01% |
| 8 | 300010 | ST Dou Shen | Social Services | 99.9 | 99.4 | 41.8 | 13.8 | 98.6 | -0.40% |
| 9 | 301190 | Shan Shui Technology | Basic Chemicals | 99.8 | 99.6 | 99.2 | 91.8 | 100.0 | +11.31% |
| 10 | 002388 | New sub-process | Electronics | 99.8 | 98.7 | 98.8 | 94.5 | 99.0 | +10.04% |
| 11 | 002827 | Gaozheng Minbao | Basic Chemicals | 99.8 | 99.7 | 98.8 | 89.7 | 58.9 | +6.70% |
| 12 | 688026 | Jet Biology | Pharmaceutical and Biotech | 99.8 | 99.6 | 98.3 | 92.2 | 98.8 | -4.44% |
| 13 | 301251 | Wilgau | Electronics | 99.8 | 83.4 | 88.5 | 85.7 | 98.9 | -4.89% |
| 14 | 600371 | Wanxiang Denong | Agriculture, Forestry, Animal Husbandry, and Fishery | 99.8 | 99.7 | 98.5 | 93.8 | 95.0 | +9.99% |
| 15 | 301080 | Bepacess | Pharmaceutical and Biotech | 99.7 | 100.0 | 99.8 | 97.0 | 99.3 | -1.02% |
| 16 | 300192 | Cod education | Social Services | 99.7 | 98.0 | 93.2 | 85.6 | 98.5 | +1.49% |
| 17 | 300981 | Zhonghong Medical | Pharmaceutical and Biotech | 99.7 | 99.4 | 98.2 | 94.4 | 99.2 | +19.98% |
| 18 | 603221 | Aili Home Furnishing | Manufacturing | 99.7 | 99.7 | 99.5 | 96.9 | 7.1 | +4.69% |
| 19 | 688203 | Hai Zheng Raw Wood | Basic Chemicals | 99.7 | 98.2 | 97.7 | 87.4 | 99.1 | +4.17% |
| 20 | 601086 | Guofang Group | Wholesale and Retail Trade | 99.6 | 99.5 | 98.3 | 87.0 | 97.6 | +10.01% |
Hong Kong – RPS Leaders Top 20
From the RPS 50 ranking list of this week, the strong distribution of Hong Kong stocks is mainly concentrated in real estate and construction · real estate (3 stocks), industry · construction (3 stocks), and industry · industrial engineering (2 stocks). Huaxia Cultural Technology and Weigong Holdings are at the forefront, showing that funds still prefer directions with relatively higher relative strength. Before the trend is destroyed, continuously observe the diffusion degree and pullback support of leading sectors; if breadth contracts, then the chase price rhythm should be reduced.
| Ranking | Code | Name | Sector/Industry | RPS 50 | RPS 90 | RPS 120 | RPS 250 | RPS 20 | Today's Change |
|---|---|---|---|---|---|---|---|---|---|
| 1 | 1566.HK | Huaxia Cultural Technology | Communication Services · Tourism and Leisure Facilities | 100.0 | 100.0 | 100.0 | 100.0 | 98.6 | +8.85% |
| 2 | 1793.HK | Weigong Holdings | Industrial · Construction | 100.0 | 99.9 | 99.8 | 99.7 | 99.5 | +11.72% |
| 3 | 1489.HK | Chinese name not provided (1489) | Industrial · Construction | 99.9 | 99.9 | 99.7 | 98.2 | 94.9 | -8.96% |
| 4 | 1826.HK | Fengzhan Holdings | Industrial · Construction | 99.9 | 99.8 | 99.0 | 99.4 | 95.4 | -4.79% |
| 5 | 8098.HK | Changli Holdings | Financial Services · Other Financial | 99.9 | 99.8 | 99.6 | 98.9 | 100.0 | +19.15% |
| 6 | 9968.HK | Huijing Holdings | Real Estate and Construction · Real Estate | 99.8 | 99.7 | 99.5 | 99.3 | 99.9 | -4.02% |
| 7 | 2738.HK | Huajin International Holdings | Materials · General Metals and Ores | 99.8 | 98.0 | 42.7 | 20.2 | 1.0 | -4.52% |
| 8 | 0147.HK | International Commercial Settlement | Properties and Construction · Information Technology Equipment | 99.8 | 98.5 | 97.6 | 30.9 | 72.5 | +1.10% |
| 9 | 1529.HK | Le International Holdings | Industrials · Industrial Transportation | 99.7 | 99.0 | 97.9 | 93.9 | 92.6 | +0.47% |
| 10 | 1536.HK | Yurong Group | Industrial · Industrial Engineering | 99.7 | 96.8 | 97.3 | 96.3 | 99.6 | +5.43% |
| 11 | 1046.HK | Huanyu Entertainment Culture | Communications Services · Media and Entertainment | 99.6 | 99.6 | 99.4 | 96.8 | 98.0 | +4.14% |
| 12 | 1753.HK | Duiba | Communications Services · Media and Entertainment | 99.6 | 99.0 | 99.0 | 90.4 | 6.9 | +1.06% |
| 13 | 2048.HK | Yiju Enterprise Holdings | Real Estate and Construction · Real Estate | 99.6 | 89.7 | 74.7 | 35.2 | 4.6 | 0.00% |
| 14 | 1936.HK | Litmi | Necessity Consumption · Agricultural Products | 99.5 | 99.3 | 98.9 | 98.0 | 99.9 | +18.61% |
| 15 | 0186.HK | Minjie Holding | Real Estate and Construction · Real Estate | 99.5 | 98.2 | 97.2 | 91.2 | 23.2 | +4.69% |
| 16 | 1196.HK | Weilu Technology Shares | Industrial · Industrial Engineering | 99.5 | 90.4 | 89.7 | 80.0 | 96.9 | +1.12% |
| 17 | 1906.HK | Boni Holdings | Non-essential Consumption · Textile and Apparel | 99.4 | 99.2 | 98.5 | 95.7 | 99.3 | +5.72% |
| 18 | 8147.HK | Huis Pacific | Information Technology · Home Appliances and Supplies | 99.4 | 92.4 | 89.9 | 82.4 | 99.8 | -0.48% |
| 19 | 2450.HK | Huaibei Green Gold Co., Ltd. | Raw materials · Construction | 99.3 | 99.2 | 99.3 | 98.9 | 99.2 | -0.90% |
| 20 | 8285.HK | Senhao Group | Non-essential Consumption · Textile and Apparel | 99.3 | 98.4 | 98.9 | 96.6 | 92.5 | -0.93% |
U.S. Stocks – RPS Leaders Top 20
From the RPS 50 ranking list of this week, the strong distribution of US stocks is mainly concentrated in Consumer Discretionary (5 stocks), Finance (3 stocks), and Health Care (3 stocks). Alpha Compute Corp and Professional Diversity Network, Inc. are at the forefront, showing that funds still prefer directions with relatively higher relative strength. Before the trend is destroyed, continuously observe the diffusion degree and pullback support of leading sectors; if breadth contracts, then the chase price rhythm should be reduced.
| Ranking | Code | Name | Sector/Industry | RPS 50 | RPS 90 | RPS 120 | RPS 250 | RPS 20 | Today's Change |
|---|---|---|---|---|---|---|---|---|---|
| 1 | ALP | Alpha Compute Corp | Finance | 100.0 | 100.0 | 100.0 | 9.0 | 49.2 | +5.31% |
| 2 | IPDN | Professional Diversity Network, Inc. | Technology | 100.0 | 99.9 | 99.7 | 73.4 | 100.0 | -16.15% |
| 3 | NRSN | NeuroSense Therapeutics Ltd. | Health Care | 100.0 | 99.8 | 99.8 | 99.0 | 100.0 | +2.23% |
| 4 | CPOP | Pop Culture Group Co., Ltd | Consumer Discretionary | 100.0 | 36.2 | 17.2 | 8.9 | 100.0 | -1.73% |
| 5 | USDE | StablecoinX Inc. | Finance | 100.0 | 0.0 | 0.0 | 0.0 | 99.4 | -3.83% |
| 6 | SVRN | SVRN, Inc. | Consumer Discretionary | 99.9 | 99.8 | 99.8 | 90.7 | 99.9 | +12.47% |
| 7 | MRNX | Defiance Daily Target 2X Long MRNA ETF | ETF:Leveraged | 99.9 | 100.0 | 99.8 | 0.0 | 99.7 | +27.64% |
| 8 | TJGC | TJGC Group Limited | Consumer Discretionary | 99.9 | 100.0 | 100.0 | 99.8 | 99.8 | +0.85% |
| 9 | WFF | HOLDING LIMITED | Consumer Discretionary | 99.9 | 99.9 | 99.9 | 98.7 | 99.9 | +499.51% |
| 10 | OPTT | Ocean Power Technologies, Inc. | Utilities | 99.9 | 99.2 | 98.9 | 93.2 | 100.0 | -5.56% |
| 11 | CYPH | Cypherpunk Technologies Inc. | Health Care | 99.9 | 99.6 | 99.6 | 99.7 | 98.0 | +4.63% |
| 12 | PSIG | PS International Group Ltd. | Industrials | 99.9 | 8.4 | 22.0 | 87.0 | 99.6 | +5.37% |
| 13 | AVAT | Avalanche Treasury Corporation | Finance | 99.9 | 1.0 | 1.2 | 3.7 | 97.8 | -3.03% |
| 14 | MRNA | Moderna, Inc. | Health Care | 99.9 | 99.9 | 99.7 | 99.9 | 99.3 | +14.21% |
| 15 | PUL | GraniteShares 2x Long P Daily ETF | ETF:Leveraged | 99.8 | 0.0 | 0.0 | 0.0 | 99.8 | +4.96% |
| 16 | BWET | Breakwave Tanker Shipping ETF | ETF | 99.8 | 99.9 | 99.9 | 100.0 | 98.7 | -1.43% |
| 17 | HXF | Mast HedgeIndex Managed Futures Strategy ETF | ETF | 99.8 | 99.7 | 99.4 | 0.0 | 77.4 | -0.19% |
| 18 | AIFA | All In FutureTech Alliance, Inc. | Consumer Discretionary | 99.8 | 99.3 | 94.3 | 64.2 | 99.5 | -10.13% |
| 19 | DAIC | CID HoldCo, Inc. | Technology | 99.8 | 10.0 | 5.3 | 1.7 | 27.7 | -9.13% |
| 20 | RFAI | RF Acquisition Corp II | Shell/SPAC | 99.8 | 99.8 | 99.7 | 99.3 | 97.7 | +0.90% |
Japan stocks - Top RPS strong stocks 20
From the RPS 50 ranking list of this week, the strong distribution of Japanese stocks is mainly concentrated in Information and Communications Industry (8 stocks), Service Industry (3 stocks), and Electrical Machines (3 stocks). Minato Holdings and Feature are at the forefront, showing that funds still prefer directions with relatively higher relative strength. Before the trend is destroyed, continuously observe the diffusion degree and pullback support of leading sectors; if breadth contracts, then the chase price rhythm should be reduced.
| Ranking | Code | Name | Sector/Industry | RPS 50 | RPS 90 | RPS 120 | RPS 250 | RPS 20 | Today's Change |
|---|---|---|---|---|---|---|---|---|---|
| 1 | 6862.T | Minato Holdings | Electrical Machinery | 100.0 | 99.9 | 99.5 | 99.8 | 95.8 | +3.30% |
| 2 | 4052.T | Feature | Information and Communication Industry | 100.0 | 100.0 | 100.0 | 98.7 | 93.4 | +1.90% |
| 3 | 3131.T | Shinden High Tech | Wholesale | 100.0 | 99.9 | 99.9 | 98.3 | 99.0 | +4.23% |
| 4 | 2737.T | Tomen Device | Wholesale | 99.9 | 100.0 | 100.0 | 99.9 | 97.8 | +7.11% |
| 5 | 3787.T | Technomathematical | Information and Communication Industry | 99.9 | 99.4 | 90.9 | 68.9 | 99.8 | +0.29% |
| 6 | 4588.T | Oncolys BioPharma | Pharmaceuticals | 99.9 | 99.7 | 99.8 | 100.0 | 88.6 | -3.24% |
| 7 | 6027.T | Lawyer.com | Services | 99.8 | 99.8 | 99.2 | 90.7 | 84.4 | +4.96% |
| 8 | 4398.T | Broadband Security | Information and Communication Industry | 99.8 | 99.8 | 99.6 | 96.5 | 100.0 | 0.00% |
| 9 | 593A.T | Tiafo | Information and Communication Industry | 99.8 | 0.0 | 0.0 | 0.0 | 45.6 | -6.46% |
| 10 | 153A.T | Cowris | Information and Communication Industry | 99.8 | 88.6 | 98.9 | 67.0 | 99.7 | -4.19% |
| 11 | 6570.T | Kyowa Corporation | Services | 99.7 | 100.0 | 100.0 | 99.4 | 98.0 | +1.33% |
| 12 | 9246.T | Project Holdings | Services | 99.7 | 99.7 | 99.3 | 91.2 | 99.9 | 0.00% |
| 13 | 6998.T | Japanese Tungsten | Electrical Machinery | 99.7 | 99.2 | 98.4 | 98.8 | 95.2 | +2.04% |
| 14 | 5985.T | Sun Call | Metal Products | 99.7 | 96.7 | 97.5 | 97.6 | 96.4 | +0.86% |
| 15 | 338A.T | ZenmuTech | Information and Communication Industry | 99.6 | 99.3 | 98.9 | 93.2 | 99.9 | -16.43% |
| 16 | 4884.T | Klingle Pharma | Pharmaceuticals | 99.6 | 98.0 | 92.2 | 83.0 | 99.4 | +17.70% |
| 17 | 4493.T | Cybersecurity Cloud | Information and Communication Industry | 99.6 | 99.6 | 99.6 | 96.1 | 100.0 | +10.12% |
| 18 | 2962.T | Technisco | Metal Products | 99.5 | 99.8 | 99.8 | 99.9 | 99.5 | -1.43% |
| 19 | 6904.T | Harada Kogyo | Electrical Machinery | 99.5 | 99.6 | 98.7 | 94.6 | 99.3 | +1.37% |
| 20 | 3042.T | Secure Vale | Information and Communication Industry | 99.5 | 99.4 | 99.1 | 92.8 | 99.8 | +9.01% |
Referenceable Research Conclusions (2026-10-09 Data Snapshot)
The following conclusions are automatically generated by our database at 2026-10-09, with statistical objects being individual stocks in each market that have effective RPS 50 values in the current period. All proportions are current cross-sectional statistics and do not include future return predictions.
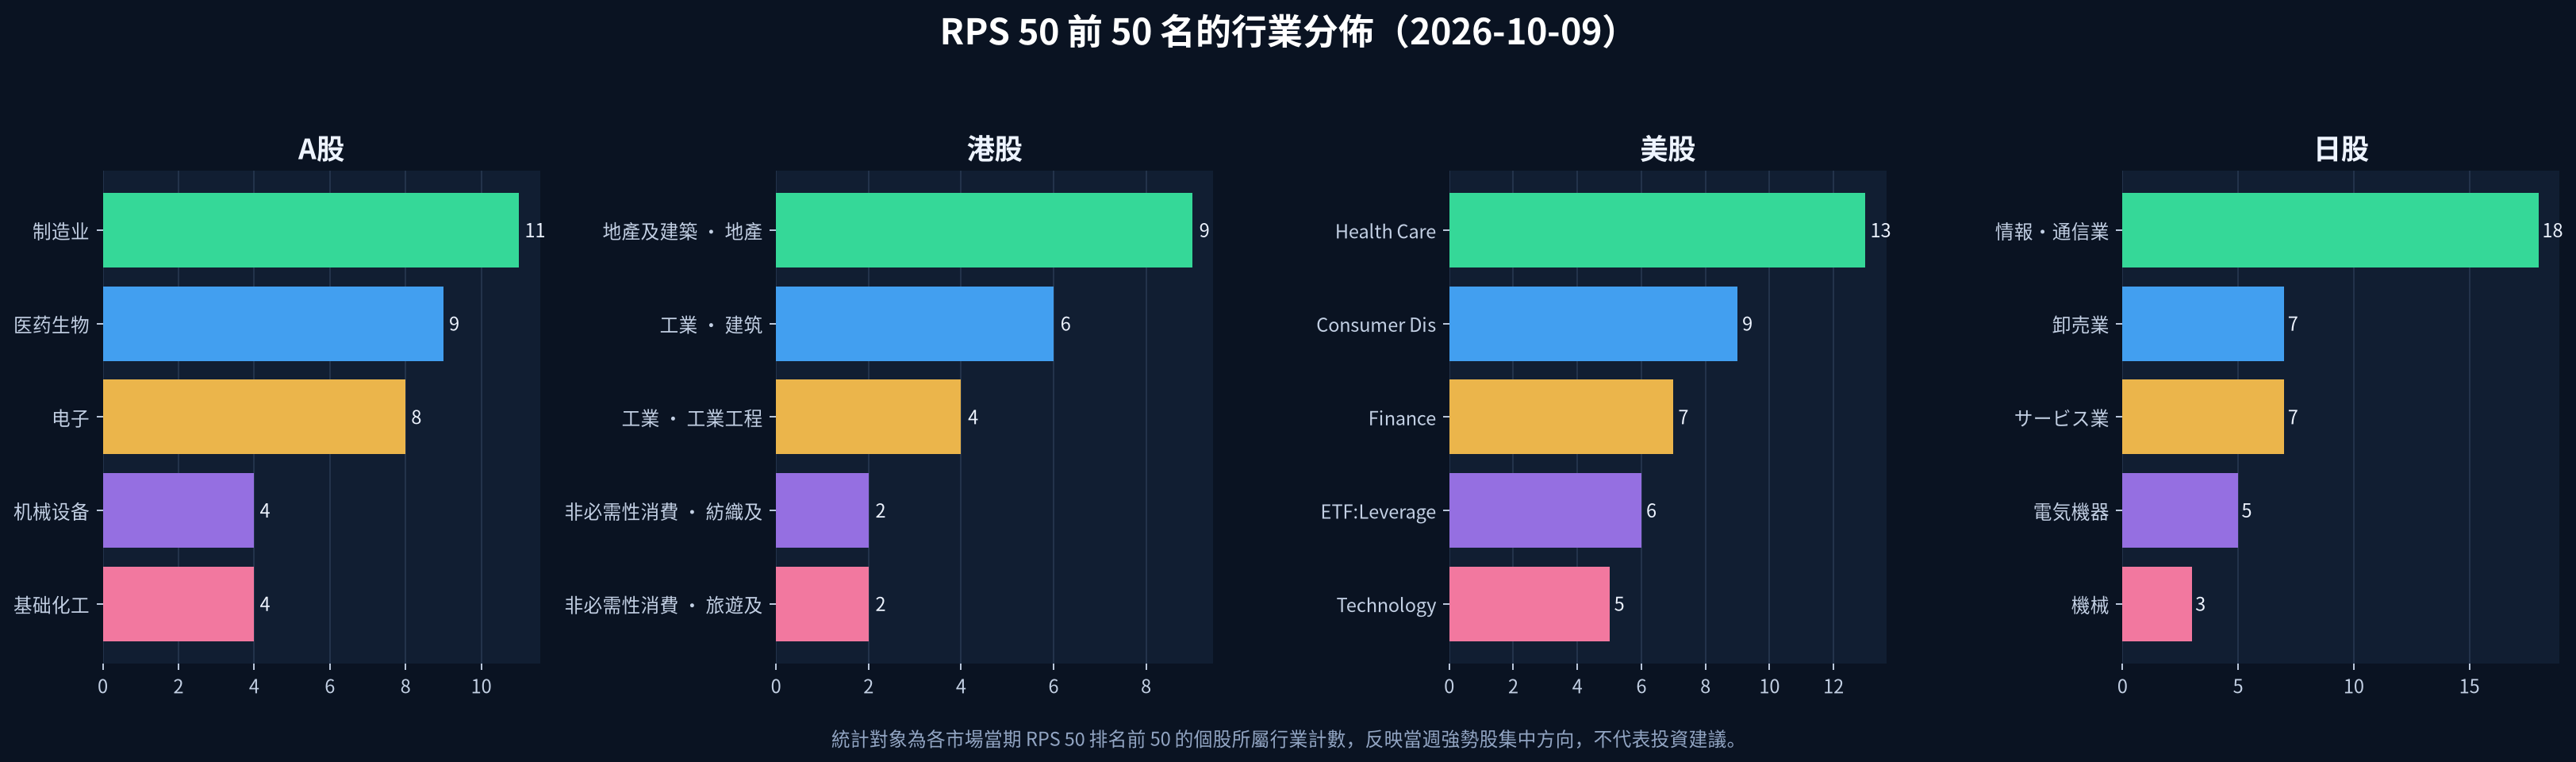
- China A-shares: Current effective samples 5,212 stocks, among which the individual stocks with RPS 50 ≥ 90 are 523 stocks (accounting for 10.0%); the industry with the most appearances in the top 50 names is manufacturing (11 stocks).
- Hong Kong stocksIn the current period's effective sample: 2,775 category, among which the stock category 278 where RPS 50 ≥ 90 (accounting for 10.0%); the industry that appears most frequently in the top 50 is Real Estate & Construction · Real Estate (9 category).
- US stocksCurrent effective sample: 8,974 groups, where the individual stocks in the RPS 50 ≥ 90 group are in the 900 group (accounting for 10.0%); the most common industry among the top 50 is Health Care (13 group).
- Japan stocksCurrent valid sample: 3,687 stocks, among which there are 369 stocks with RPS 50 ≥ 90 (accounting for 10.0%); the most frequent industry in the top 50 is Information and Communications Industry (18 stocks).
| Market | Valid sample | RPS 50 ≥ 90 | RPS 50 ≥ 80 | Leading industry in the top 50 names |
|---|---|---|---|---|
| China A-shares | 5,212 | 523(10.0%) | 1,043 | Manufacturing (11 stocks) |
| Hong Kong stocks | 2,775 | 278(10.0%) | 556 | Real Estate & Construction · Real Estate (9 stocks) |
| US stocks | 8,974 | 900(10.0%) | 1,798 | Health Care (13 rank) |
| Japan stocks | 3,687 | 369(10.0%) | 738 | Information and Communication (18 range) |
Data range and stock pool, please refer to Cross-market data coverage archive; Indicator scope and window definitions, please refer to RPS methodology; Statistical and editing processes, please refer to Research and editorial standardsWhen citing this page, please indicate the data snapshot date 2026-10-09.
This report is automatically generated by the system, and the AI summary is based only on current data. RPS is a technical analysis ranking tool and does not constitute any investment advice; stock investment carries risk, and past performance does not represent future returns.