RPS 50 Strong-Stock Ranking Weekly Report
This report lists the current strong targets in the four markets based on RPS 50 (50 trading days relative price strength). RPS is a historical relative performance ranking within the market, does not predict future prices, and does not constitute investment advice.
A-shares - RPS Strong Stocks Top 20
From this week's RPS 50 list,The strong distribution of A-shares is mainly concentrated in electronics (8), manufacturing (4), and pharmaceutical biotechnology (2).Nearshore protein and Xinhua Media are at the forefront.Shows that funds still prefer the direction of higher relative intensity.Until the trend is disrupted,Sustainably observe the diffusion of leading plates and step back;If the width shrinks,The rhythm of price calls should be reduced.
| Ranking | Code | Name | Sector/Industry | RPS 50 | RPS 90 | RPS 120 | RPS 250 | RPS 20 | Today's Price Change |
|---|---|---|---|---|---|---|---|---|---|
| 1 | 688137 | Nearshore Protein | Pharmaceutical and Biotech | 100.0 | 100.0 | 99.9 | 99.6 | 99.9 | -7.79% |
| 2 | 600825 | Xinhua Media | Culture, Sports and Entertainment Industry | 100.0 | 99.9 | 99.9 | 98.2 | 100.0 | +9.98% |
| 3 | 605058 | Aohong Electronics | Manufacturing | 100.0 | 99.5 | 99.3 | 98.3 | 99.9 | -6.61% |
| 4 | 301251 | Wilgau | Electronics | 99.9 | 98.8 | 91.5 | 91.0 | 98.9 | -8.72% |
| 5 | 002667 | * ST Wellington | Machinery | 99.9 | 98.0 | 72.7 | 97.8 | 99.6 | -10.00% |
| 6 | 600127 | Jinjian Rice Industry | Manufacturing | 99.9 | 99.9 | 99.7 | 98.2 | 90.5 | +8.86% |
| 7 | 301190 | Shan Shui Technology | Basic Chemicals | 99.9 | 99.8 | 99.7 | 95.7 | 100.0 | -3.35% |
| 8 | 301132 | Mankun Technology | Electronics | 99.9 | 99.5 | 98.8 | 97.2 | 99.6 | -9.10% |
| 9 | 603221 | Aili Home Furnishing | Manufacturing | 99.8 | 99.8 | 99.7 | 96.7 | 40.0 | +7.21% |
| 10 | 002388 | New sub-process | Electronics | 99.8 | 99.0 | 99.4 | 96.0 | 99.4 | +10.04% |
| 11 | 601811 | Xinhua Wenxuan | Culture, Sports and Entertainment Industry | 99.8 | 99.8 | 99.6 | 97.0 | 100.0 | +10.01% |
| 12 | 301122 | Adoption OF shares | Pharmaceutical and Biotech | 99.8 | 99.9 | 99.7 | 99.1 | 99.4 | -3.99% |
| 13 | 001326 | Union Domain Shares | Home Appliances | 99.8 | 97.8 | 99.0 | 97.4 | 98.9 | -0.57% |
| 14 | 301282 | Jinlu Electronics | Electronics | 99.8 | 98.9 | 83.7 | 95.7 | 92.9 | -8.83% |
| 15 | 002815 | Chongda Technology | Electronics | 99.7 | 98.0 | 98.2 | 94.8 | 98.9 | +0.95% |
| 16 | 002811 | Designed by Zheng Zhong | Building Decorative | 99.7 | 99.6 | 98.3 | 96.2 | 99.7 | +5.94% |
| 17 | 002913 | Oskon | Electronics | 99.7 | 98.8 | 98.7 | 97.5 | 97.3 | -5.72% |
| 18 | 688655 | Xunjie Xing | Electronics | 99.7 | 87.6 | 99.1 | 99.3 | 94.8 | -6.18% |
| 19 | 300939 | Akita Wei | Electronics | 99.7 | 97.4 | 99.8 | 99.0 | 99.0 | -0.89% |
| 20 | 600241 | Era Wanheng | Manufacturing | 99.6 | 99.7 | 97.8 | 96.1 | 99.9 | +1.14% |
Hong Kong stocks - RPS Strong Stocks Top 20
From this week's RPS 50 list,The strong distribution of Hong Kong stocks is mainly concentrated in industry and construction (3), communication services and media and entertainment (2), raw materials and general metals and ore (1).Huaxia Culture and Technology and Changli Holdings are at the forefront.Shows that funds still prefer the direction of higher relative intensity.Until the trend is disrupted,Sustainably observe the diffusion of leading plates and step back;If the width shrinks,The rhythm of price calls should be reduced.
| Ranking | Code | Name | Sector/Industry | RPS 50 | RPS 90 | RPS 120 | RPS 250 | RPS 20 | Today's Price Change |
|---|---|---|---|---|---|---|---|---|---|
| 1 | 1566.HK | Huaxia Cultural Technology | Communication Services · Tourism and Leisure Facilities | 100.0 | 100.0 | 100.0 | 100.0 | 97.1 | -11.12% |
| 2 | 8098.HK | Changli Holdings | Financial Services · Other Financial | 100.0 | 100.0 | 99.8 | 99.2 | 100.0 | -1.28% |
| 3 | 1793.HK | Weigong Holdings | Industrial · Construction | 99.9 | 99.9 | 99.7 | 99.6 | 89.2 | -1.62% |
| 4 | 1753.HK | Duiba | Communication Services · Media and Entertainment | 99.9 | 99.7 | 99.3 | 96.1 | 91.9 | -5.96% |
| 5 | 1489.HK | No Chinese Name Provided (1489) | Industrial · Construction | 99.9 | 99.8 | 99.8 | 99.0 | 15.1 | +8.48% |
| 6 | 1826.HK | Fengzhan Holdings | Industrial · Construction | 99.8 | 99.8 | 99.0 | 99.4 | 80.5 | +6.40% |
| 7 | 0147.HK | International Business Settlement | Real Estate and Construction · Information Technology Equipment | 99.8 | 98.7 | 98.2 | 32.9 | 29.5 | +9.58% |
| 8 | 1046.HK | Banyuan Entertainment Culture | Communication Services · Media and Entertainment | 99.8 | 99.5 | 99.3 | 97.1 | 96.2 | +5.76% |
| 9 | 2738.HK | Huajin International Holdings | Raw Materials · General Metals and Minerals | 99.7 | 97.8 | 29.7 | 19.1 | 6.2 | 0.00% |
| 10 | 8527.HK | Julibao Holdings | Non-essential consumption · tourism and leisure facilities | 99.7 | 99.0 | 98.9 | 97.5 | 99.7 | +1.69% |
| 11 | 1529.HK | Leshi International Holdings | Industrial · Industrial Transportation | 99.6 | 99.3 | 97.5 | 94.4 | 94.1 | +7.65% |
| 12 | 9968.HK | Hui Jing Holdings | Real Estate and Architecture · Real Estate | 99.6 | 99.1 | 99.2 | 99.0 | 97.8 | +6.56% |
| 13 | 1936.HK | Litmi | Essential Consumption · Agricultural Products | 99.6 | 99.3 | 98.8 | 97.8 | 99.9 | -0.20% |
| 14 | 2450.HK | Huaibei Green Gold Co., Ltd. | Raw materials · Construction | 99.5 | 99.5 | 99.5 | 99.2 | 99.8 | +2.11% |
| 15 | 8147.HK | Xisi Pacific | IT · Home Appliances & Supplies | 99.5 | 92.9 | 91.2 | 81.1 | 99.9 | +3.11% |
| 16 | 1560.HK | Xingxing Group | Industrial · real estate | 99.5 | 98.9 | 98.0 | 95.0 | 86.8 | -3.75% |
| 17 | 8285.HK | Senhao Group | Nonessential Consumption · Textile and Apparel | 99.4 | 99.0 | 98.9 | 96.9 | 72.6 | -0.93% |
| 18 | 1817.HK | Musang Group Holdings | Nonessential Consumption · Professional Retail | 99.4 | 98.7 | 97.7 | 90.4 | 99.8 | +4.20% |
| 19 | 1198.HK | Dynasty Home | Non-essential consumption · Household appliances and supplies | 99.3 | 98.4 | 97.4 | 82.9 | 100.0 | +5.29% |
| 20 | 2028.HK | Yingmei Holdings | Information Technology · Information Technology Equipment | 99.3 | 99.6 | 100.0 | 100.0 | 18.6 | +2.04% |
US Stocks - RPS Strong Stocks Top 20
From this week's RPS 50 list,The strong distribution of US stocks is mainly concentrated in Health Care (7), Consumer Discretionary (4), and Finance (3).GT Biopharma,Inc., SkinHealth Systems Inc. in the forefront,Shows that funds still prefer the direction of higher relative intensity.Until the trend is disrupted,Sustainably observe the diffusion of leading plates and step back;If the width shrinks,The rhythm of price calls should be reduced.
| Ranking | Code | Name | Sector/Industry | RPS 50 | RPS 90 | RPS 120 | RPS 250 | RPS 20 | Today's Price Change |
|---|---|---|---|---|---|---|---|---|---|
| 1 | GTBP | GT Biopharma, Inc. | Health Care | 100.0 | 100.0 | 100.0 | 100.0 | 49.2 | -4.48% |
| 2 | SKIN | SkinHealth Systems Inc. | Health Care | 100.0 | 100.0 | 100.0 | 99.9 | 100.0 | -16.19% |
| 3 | NFE | New Fortress Energy Inc. | Utilities | 100.0 | 99.9 | 99.9 | 98.2 | 0.7 | -0.72% |
| 4 | BTOC | Armlogi Holding Corp. | Consumer Discretionary | 100.0 | 100.0 | 100.0 | 99.6 | 100.0 | +1.05% |
| 5 | CPOP | Pop Culture Group Co., Ltd | Consumer Discretionary | 100.0 | 44.8 | 75.3 | 11.5 | 16.5 | +2.95% |
| 6 | TJGC | TJGC Group Limited | Consumer Discretionary | 99.9 | 99.9 | 100.0 | 99.9 | 99.8 | 0.00% |
| 7 | MTNB | Matinas Biopharma Holdings, Inc. | Health Care | 99.9 | 99.8 | 99.8 | 89.3 | 100.0 | -2.07% |
| 8 | BRTX | BioRestorative Therapies, Inc. | Health Care | 99.9 | 99.9 | 99.9 | 44.0 | 3.1 | +5.48% |
| 9 | MRNX | Defiance Daily Target 2X Long MRNA ETF | ETF:Leveraged | 99.9 | 100.0 | 99.9 | 0.0 | 99.7 | -15.91% |
| 10 | IPDN | Professional Diversity Network, Inc. | Technology | 99.9 | 99.9 | 99.7 | 20.1 | 11.5 | -3.27% |
| 11 | SVRN | SVRN, Inc. | Consumer Discretionary | 99.9 | 99.8 | 99.8 | 63.0 | 99.7 | -16.11% |
| 12 | NCPL | Netcapital Inc. | Finance | 99.9 | 99.6 | 99.9 | 42.9 | 100.0 | +9.60% |
| 13 | USDE | StablecoinX Inc. | Finance | 99.9 | 0.0 | 0.0 | 0.0 | 91.1 | -6.46% |
| 14 | BTLN | Brightline Interactive, Inc. | Technology | 99.9 | 99.9 | 99.9 | 99.2 | 100.0 | -14.31% |
| 15 | MRNA | Moderna, Inc. | Health Care | 99.8 | 99.9 | 99.9 | 99.9 | 99.3 | -7.82% |
| 16 | CYPH | Cypherpunk Technologies Inc. | Health Care | 99.8 | 99.8 | 99.5 | 99.7 | 7.3 | -14.90% |
| 17 | HXF | Mast HedgeIndex Managed Futures Strategy ETF | ETF | 99.8 | 99.7 | 99.4 | 0.0 | 73.4 | +0.04% |
| 18 | PSIG | PS International Group Ltd. | Industrials | 99.8 | 5.9 | 14.5 | 65.1 | 93.4 | +4.71% |
| 19 | PMI | Picard Medical, Inc. | Health Care | 99.8 | 18.4 | 5.3 | 1.7 | 99.9 | +27.50% |
| 20 | AVAT | Avalanche Treasury Corporation | Finance | 99.8 | 1.6 | 1.5 | 4.0 | 96.3 | -9.02% |
Japan Stocks - RPS Strong Stocks Top 20
From this week's RPS 50 list,The strong distribution of Japanese stocks is mainly concentrated in the intelligence and communication industry (11), the service industry (5), and electrical machinery (2).Showcase, Secure Vale at the forefront,Shows that funds still prefer the direction of higher relative intensity.Until the trend is disrupted,Sustainably observe the diffusion of leading plates and step back;If the width shrinks,The rhythm of price calls should be reduced.
| Ranking | Code | Name | Sector/Industry | RPS 50 | RPS 90 | RPS 120 | RPS 250 | RPS 20 | Today's Price Change |
|---|---|---|---|---|---|---|---|---|---|
| 1 | 3909.T | Showcase | Information and Communication Industry | 100.0 | 100.0 | 99.9 | 97.1 | 100.0 | +17.39% |
| 2 | 3042.T | Secure Vale | Information and Communication Industry | 100.0 | 100.0 | 100.0 | 99.3 | 100.0 | +18.75% |
| 3 | 4240.T | Cluster Technology | Chemicals | 100.0 | 99.9 | 99.5 | 98.8 | 100.0 | +19.18% |
| 4 | 4382.T | HEROZ | Information and Communication Industry | 99.9 | 99.8 | 99.2 | 87.9 | 99.9 | +20.63% |
| 5 | 3787.T | Technomathematical | Information and Communication Industry | 99.9 | 99.2 | 92.4 | 65.4 | 99.7 | +0.29% |
| 6 | 4052.T | Feature | Information and Communication Industry | 99.9 | 100.0 | 99.9 | 97.9 | 3.0 | -1.25% |
| 7 | 338A.T | ZenmuTech | Information and Communication Industry | 99.8 | 99.7 | 96.6 | 94.1 | 99.3 | +9.56% |
| 8 | 6570.T | Kyowa Corporation | Services | 99.8 | 99.9 | 100.0 | 99.6 | 98.7 | +9.41% |
| 9 | 153A.T | Cowris | Information and Communication Industry | 99.8 | 96.4 | 98.1 | 67.5 | 99.5 | +12.76% |
| 10 | 6862.T | Minato Holdings | Electrical Machinery | 99.8 | 99.4 | 98.8 | 99.8 | 86.2 | +2.32% |
| 11 | 4398.T | Broadband Security | Information and Communication Industry | 99.7 | 99.4 | 99.5 | 96.5 | 99.8 | +13.61% |
| 12 | 4493.T | Cybersecurity Cloud | Information and Communication Industry | 99.7 | 99.6 | 99.7 | 97.2 | 99.9 | +21.14% |
| 13 | 9246.T | Project Holdings | Services | 99.7 | 99.6 | 99.5 | 93.1 | 99.8 | 0.00% |
| 14 | 593A.T | Tiafo | Information and Communication Industry | 99.7 | 0.0 | 0.0 | 0.0 | 45.1 | +0.24% |
| 15 | 6027.T | Lawyer.com | Services | 99.6 | 99.6 | 98.9 | 88.9 | 2.1 | +4.90% |
| 16 | 4178.T | Sharing Innovations | Information and Communication Industry | 99.6 | 99.1 | 98.8 | 78.0 | 99.7 | -2.33% |
| 17 | 6721.T | Wintest | Electrical Machinery | 99.6 | 98.6 | 95.4 | 83.3 | 99.9 | +49.50% |
| 18 | 4840.T | Trias | Services | 99.5 | 88.4 | 54.1 | 95.9 | 99.3 | +15.05% |
| 19 | 6533.T | Orchestra Holdings | Services | 99.5 | 99.8 | 99.5 | 99.2 | 99.8 | -4.17% |
| 20 | 4588.T | Oncolys BioPharma | Pharmaceuticals | 99.5 | 99.5 | 98.6 | 100.0 | 2.9 | +3.39% |
Can cite study conclusions (2026-10-16 data snapshot)
The following conclusions are automatically generated by the database of this site in 2026-10-16.The statistical objects are individual stocks with valid RPS 50 values in each market in the current period.All ratios are current cross-sectional statistics.Future earnings forecasts are not included.
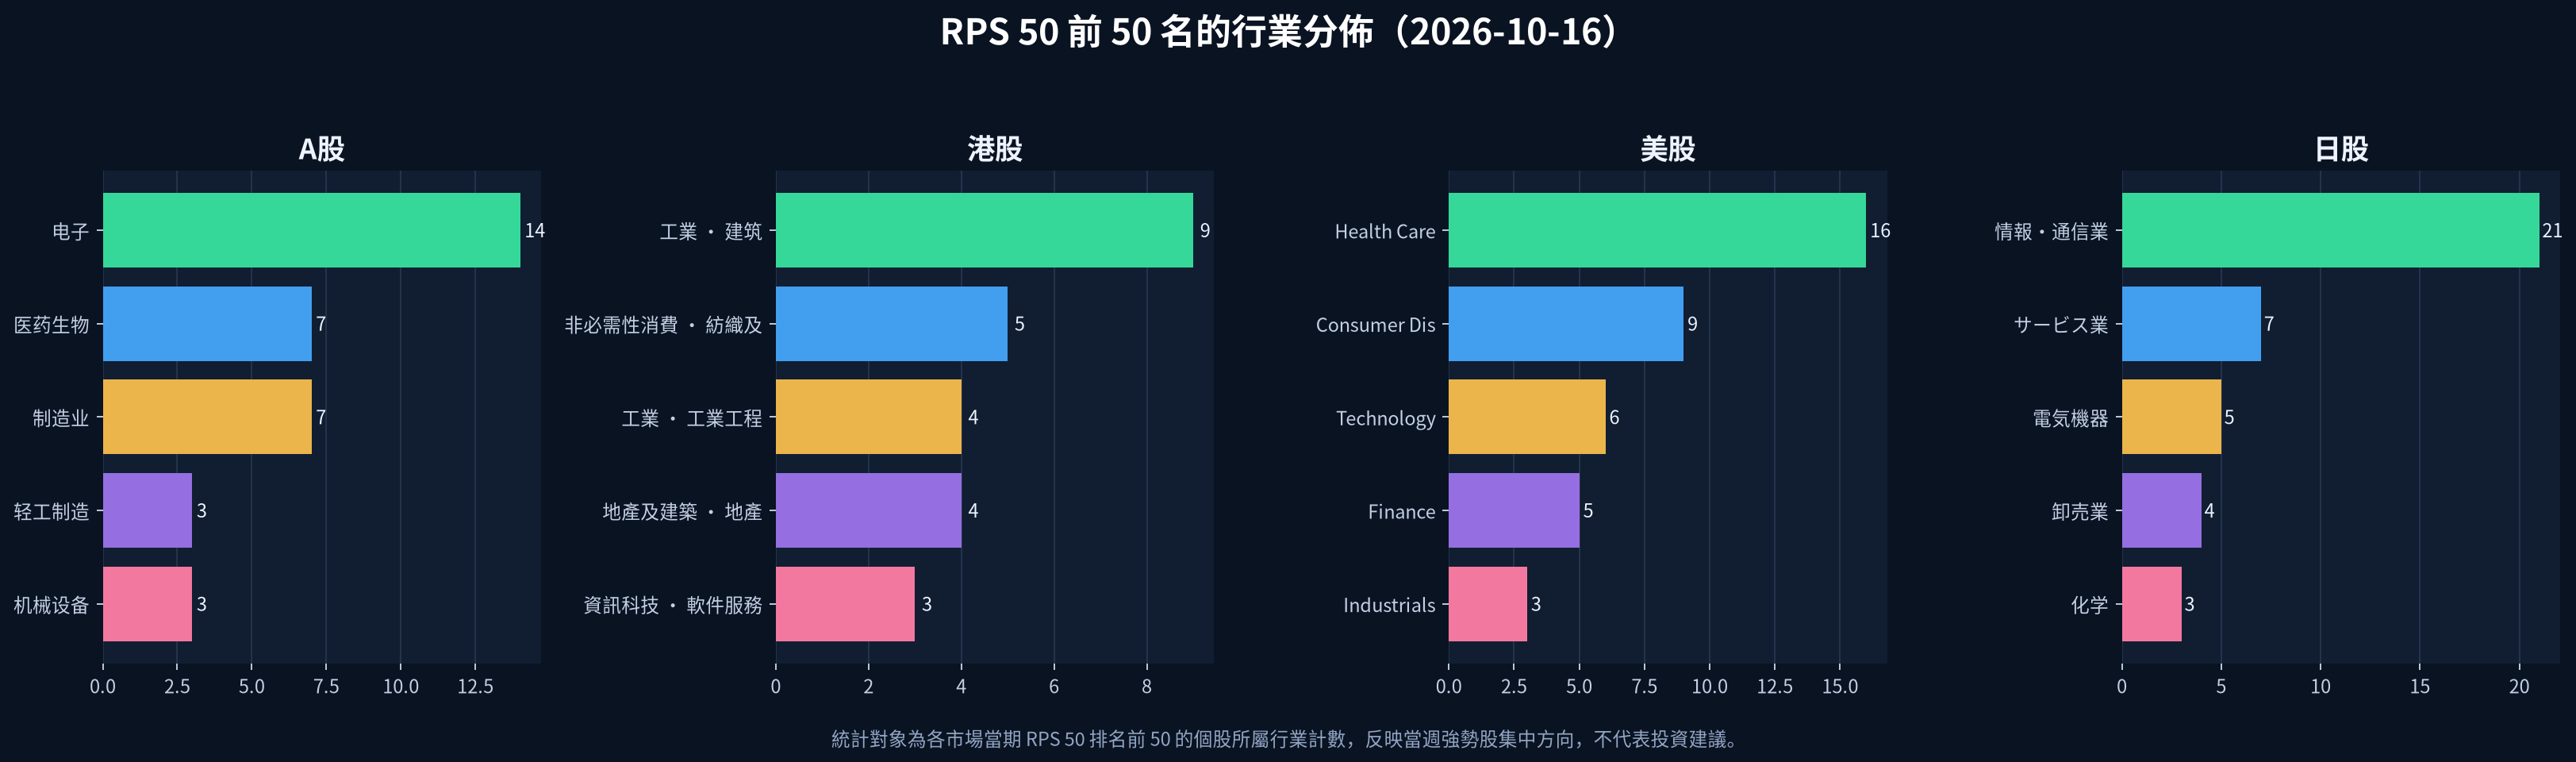
- China A-shares: Current valid sample 5,212 file,of which RPS 50 ≥ 90 522 (10.0%);The industry with the most appearances in the previous 50 name is electronics (14 file).
- Hong Kong stocks: Current valid sample 2,770 file,of which RPS 50 ≥ 90 278 (10.0%);The industry that appears the most in the previous 50 name is industrial and construction (9 file).
- US stocks: Current valid sample 8,983 file,of which RPS 50 ≥ 90 900 (10.0%);The industry with the most appearances in the top 50 name is Health Care (16 file).
- Japan stocks: Current valid sample 3,689 file,of which RPS 50 ≥ 90 371 (10.1%);The industry with the most appearances in the previous 50 name is the information and communication industry (21 file).
| Market | Effective Sample | RPS 50 ≥ 90 | RPS 50 ≥ 80 | Leading Industry in Top 50 Names |
|---|---|---|---|---|
| China A-shares | 5,212 | 522(10.0%) | 1,044 | Electronics (14 file) |
| Hong Kong stocks | 2,770 | 278(10.0%) | 555 | Industrial · Construction (9 stocks) |
| US stocks | 8,983 | 900(10.0%) | 1,802 | Health Care (File 16) |
| Japan stocks | 3,689 | 371(10.1%) | 738 | Information and communication industry (21 file) |
Please see the data range and stock pool Cross-market data coverage file; Please see the indicator definitions and window definitions RPS Methodology; Please see the statistical and editing process Research and Editing Standards. Please quote this page with the data snapshot date 2026-10-16.
This report is automatically generated by the system, the AI summary is based only on current data. RPS is a technical analysis ranking tool, does not constitute any investment advice; stock investment has risk, past performance does not represent future returns.