RPS 50 Strong-Stock Ranking Weekly Report
This report lists the current strong targets in the four markets based on RPS 50 (relative price strength of 50 trading days). RPS is the historical relative performance ranking within the market, does not predict future prices, and does not constitute investment advice.
A-shares – RPS Leaders Top 20
From this week's RPS 50 list, the strong distribution in A-shares is mainly concentrated in Media (3 only), Culture, Sports and Entertainment (3 only), and Automotive (3 only). Jiuyang Shares and Iceberg Cold Heat are at the forefront, indicating that capital still prefers directions with higher relative strength. Before the trend is destroyed, we can continuously observe the diffusion degree and rebound support of leading sectors; if the breadth contracts, the price chasing pace should be reduced.
| Ranking | Code | Name | Sector/Industry | RPS 50 | RPS 90 | RPS 120 | RPS 250 | RPS 20 | Today's Change |
|---|---|---|---|---|---|---|---|---|---|
| 1 | 002242 | JOYOUNG | Home Appliances | 100.0 | 100.0 | 100.0 | 99.9 | 99.9 | +10.02% |
| 2 | 000530 | Icebergs are hot and cold | Machinery | 100.0 | 99.9 | 99.9 | 98.0 | 99.7 | +7.73% |
| 3 | 600825 | Xinhua Media | Culture, Sports and Entertainment Industry | 100.0 | 99.8 | 99.8 | 98.2 | 3.6 | -10.00% |
| 4 | 300949 | Aoya Shares | Building Decorative | 99.9 | 99.9 | 97.9 | 88.4 | 100.0 | -2.63% |
| 5 | 600715 | Wentou Holdings | Culture, Sports and Entertainment Industry | 99.9 | 99.8 | 99.8 | 94.2 | 100.0 | -9.89% |
| 6 | 300829 | Jindan Technology | Basic Chemicals | 99.9 | 99.8 | 99.5 | 98.0 | 99.3 | +3.95% |
| 7 | 002086 | Oriental Ocean | Agriculture, forestry, animal husbandry | 99.9 | 99.9 | 99.9 | 97.6 | 100.0 | -4.61% |
| 8 | 601595 | Shanghai Film | Culture, Sports and Entertainment Industry | 99.9 | 99.8 | 99.6 | 89.4 | 98.8 | -7.83% |
| 9 | 300473 | Del Shares | Automotive | 99.8 | 99.5 | 99.1 | 98.0 | 99.7 | -5.06% |
| 10 | 002164 | Ningbo Dongli | Machinery | 99.8 | 99.5 | 99.2 | 97.2 | 99.2 | -6.36% |
| 11 | 301052 | Guomai Culture | Press | 99.8 | 99.7 | 99.6 | 82.8 | 99.6 | -6.27% |
| 12 | 000678 | Xiangyang Bearing | Automotive | 99.8 | 99.6 | 98.5 | 91.3 | 99.7 | -10.01% |
| 13 | 002708 | Guangyang Co., Ltd. | Automotive | 99.8 | 99.4 | 99.1 | 98.3 | 99.8 | -2.83% |
| 14 | 000635 | Engitech | Basic Chemicals | 99.8 | 99.6 | 99.0 | 94.5 | 99.5 | +7.74% |
| 15 | 600261 | Sunshine Lighting | Manufacturing | 99.7 | 99.6 | 99.7 | 97.7 | 99.9 | +10.04% |
| 16 | 300413 | Mango Super Media | Press | 99.7 | 99.7 | 99.7 | 83.6 | 99.0 | -6.02% |
| 17 | 300006 | Lemey Pharmaceuticals | Pharmaceutical and Biotech | 99.7 | 99.6 | 99.7 | 99.2 | 98.8 | -12.72% |
| 18 | 002343 | Ciwen Media | Press | 99.7 | 99.8 | 99.8 | 89.1 | 39.1 | -9.98% |
| 19 | 688137 | Nearshore Protein | Pharmaceutical and Biotech | 99.7 | 100.0 | 99.9 | 99.7 | 32.1 | -3.25% |
| 20 | 605488 | Fule New Materials | Manufacturing | 99.6 | 98.8 | 96.8 | 97.6 | 99.9 | -10.00% |
Hong Kong – RPS Leaders Top 20
From this week's RPS 50 list, the strong distribution in Hong Kong stocks is mainly concentrated in Property and Construction · Property (2 only), Industrial · Industrial Engineering (2 only), Industrial · Construction (2 only). Senhao Group and Changli Holdings are at the forefront, indicating that capital still prefers directions with higher relative strength. Before the trend is destroyed, we can continuously observe the diffusion degree and rebound support of leading sectors; if the breadth contracts, the price chasing pace should be reduced.
| Ranking | Code | Name | Sector/Industry | RPS 50 | RPS 90 | RPS 120 | RPS 250 | RPS 20 | Today's Change |
|---|---|---|---|---|---|---|---|---|---|
| 1 | 8285.HK | Senhao Group | Nonessential Consumption · Textile and Apparel | 100.0 | 99.9 | 99.8 | 99.2 | 100.0 | +5.17% |
| 2 | 8098.HK | Changli Holdings | Financial Services · Other Financial | 100.0 | 99.8 | 99.6 | 99.2 | 7.6 | -12.86% |
| 3 | 2885.HK | Bihang Holdings | Industrial · Industrial Engineering | 99.9 | 99.4 | 99.2 | 98.2 | 100.0 | +16.60% |
| 4 | 1936.HK | Litmi | Essential Consumption · Agricultural Products | 99.9 | 99.3 | 99.2 | 98.2 | 50.5 | -8.21% |
| 5 | 0209.HK | Wanwei Intelligent Technology | Non-essential consumption · Household appliances and supplies | 99.9 | 1.0 | 2.2 | 30.4 | 97.2 | +16.98% |
| 6 | 2450.HK | Huaibei Green Gold Co., Ltd. | Raw materials · Construction | 99.8 | 99.8 | 99.7 | 99.4 | 98.8 | -3.94% |
| 7 | 8483.HK | Master Photo | Non-essential Consumption · Support Services | 99.8 | 99.6 | 99.0 | 96.8 | 98.5 | 0.00% |
| 8 | 1355.HK | BioSystem Engineering | Non-essential consumption · tourism and leisure facilities | 99.8 | 98.8 | 98.3 | 96.4 | 99.5 | -29.00% |
| 9 | 2738.HK | Huajin International Holdings | Raw Materials · General Metals and Minerals | 99.7 | 98.9 | 94.7 | 16.1 | 8.5 | 0.00% |
| 10 | 8147.HK | Xisi Pacific | IT · Home Appliances & Supplies | 99.7 | 98.0 | 89.8 | 67.9 | 49.0 | 0.00% |
| 11 | 1826.HK | Fengzhan Holdings | Industrial · Construction | 99.6 | 99.7 | 99.9 | 99.6 | 32.2 | -2.72% |
| 12 | 9968.HK | Hui Jing Holdings | Real Estate and Architecture · Real Estate | 99.6 | 99.7 | 99.3 | 99.1 | 34.7 | -4.55% |
| 13 | 8131.HK | Noah Intelligent | Information Technology · Software Services | 99.6 | 99.3 | 99.8 | 98.7 | 96.9 | +7.27% |
| 14 | 8340.HK | Canna International Finance | Financial Services · Other Financial | 99.5 | 98.6 | 97.7 | 96.9 | 98.0 | +12.50% |
| 15 | 1341.HK | Haotian International Construction Investment | Industrial · Industrial Engineering | 99.5 | 98.6 | 95.5 | 6.2 | 99.8 | -2.70% |
| 16 | 2080.HK | Aux International | Real Estate and Architecture · Real Estate | 99.5 | 98.9 | 97.4 | 90.6 | 89.6 | +1.47% |
| 17 | 1770.HK | Dongfang Kemai | Information Technology · Industrial Engineering | 99.4 | 99.2 | 0.0 | 0.0 | 99.8 | +0.49% |
| 18 | 1580.HK | Omori Holdings | Raw Materials | 99.4 | 98.3 | 95.5 | 97.2 | 97.9 | +37.31% |
| 19 | 1500.HK | Xianheng Architecture | Industrial · Construction | 99.3 | 99.4 | 98.9 | 99.6 | 99.9 | +8.28% |
| 20 | 1166.HK | Xingkai Holdings | Industrials · General Metals and Ores | 99.3 | 98.2 | 96.4 | 46.1 | 97.0 | -5.19% |
U.S. Stocks – RPS Leaders Top 20
From this week's RPS 50 ranking, the strong distribution in US stocks is mainly concentrated in Health Care (6 stocks), Consumer Discretionary (4 stocks), and Industrials (3 stocks). Odyssey Marine Exploration, Inc. and Cosmos Health Inc. rank at the top, showing that funds still prefer directions with relatively higher relative strength. Before the trend is broken, we can continuously observe the diffusion and retracement support of leading sectors; if breadth contracts, we should reduce the pace of chasing prices.
| Ranking | Code | Name | Sector/Industry | RPS 50 | RPS 90 | RPS 120 | RPS 250 | RPS 20 | Today's Change |
|---|---|---|---|---|---|---|---|---|---|
| 1 | OMEX | Odyssey Marine Exploration, Inc. | Consumer Discretionary | 100.0 | 100.0 | 100.0 | 99.8 | 100.0 | -10.88% |
| 2 | COSM | Cosmos Health Inc. | Health Care | 100.0 | 100.0 | 100.0 | 99.6 | 100.0 | +1442.86% |
| 3 | IPDN | Professional Diversity Network, Inc. | Technology | 100.0 | 97.0 | 90.2 | 10.3 | 0.6 | -0.13% |
| 4 | NUWE | Nuwellis, Inc. | Health Care | 100.0 | 98.5 | 2.8 | 2.3 | 100.0 | -8.57% |
| 5 | PDSB | PDS Biotechnology Corporation | Health Care | 100.0 | 93.3 | 27.9 | 78.2 | 71.8 | +5.85% |
| 6 | NCPL | Netcapital Inc. | Finance | 99.9 | 100.0 | 93.0 | 72.7 | 96.3 | +21.34% |
| 7 | TOPS | TOP Ships, Inc. | Consumer Discretionary | 99.9 | 99.9 | 99.7 | 10.2 | 100.0 | -12.22% |
| 8 | TJGC | TJGC Group Limited | Consumer Discretionary | 99.9 | 100.0 | 100.0 | 100.0 | 64.1 | 0.00% |
| 9 | KOD | Kodiak Sciences Inc | Health Care | 99.9 | 99.7 | 99.8 | 99.9 | 90.5 | -9.41% |
| 10 | INDP | Indaptus Therapeutics, Inc. | Health Care | 99.9 | 96.1 | 99.7 | 93.0 | 97.2 | +8.83% |
| 11 | VEEA | Veea Inc. | Technology | 99.9 | 90.2 | 6.9 | 10.9 | 94.8 | +6.46% |
| 12 | AEMD | Aethlon Medical, Inc. | Health Care | 99.9 | 97.4 | 6.4 | 6.9 | 45.0 | -5.29% |
| 13 | PSIG | PS International Group Ltd. | Industrials | 99.9 | 99.9 | 16.2 | 84.6 | 88.8 | -8.46% |
| 14 | SNDQ | Tradr 2X Short SNDK Daily ETF | Preferred/ADR | 99.9 | 96.3 | 10.1 | 0.0 | 99.7 | +16.89% |
| 15 | BGIN | Bgin Blockchain Limited | Finance | 99.8 | 99.8 | 98.3 | 95.0 | 99.9 | +35.05% |
| 16 | ULBI | Ultralife Corporation | Miscellaneous | 99.8 | 99.8 | 99.4 | 99.2 | 99.9 | -0.32% |
| 17 | HLP | Hongli Group Inc. | Industrials | 99.8 | 99.8 | 100.0 | 98.7 | 96.6 | -11.41% |
| 18 | EGG | Enigmatig Limited Class A Ordinary Shares | Consumer Discretionary | 99.8 | 37.5 | 19.3 | 94.5 | 98.5 | +18.80% |
| 19 | GIBO | GIBO Holdings Limited | Technology | 99.8 | 99.9 | 99.7 | 96.4 | 99.2 | +5.74% |
| 20 | ETS | Elite Express Holding Inc. | Industrials | 99.8 | 99.8 | 99.9 | 99.7 | 35.9 | +34.93% |
Japan stocks - Top RPS strong stocks 20
From this week's RPS 50 ranking, the strong distribution in Japanese stocks is primarily concentrated in Information and Communications (6 stocks), Services (4 stocks), and Chemicals (3 stocks). Showcase and Secure Veil lead the pack, indicating that funds continue to favor directions with relatively higher relative strength. Before the trend is broken, we can continuously monitor the diffusion of leading sectors and their support upon pullbacks; if breadth contracts, the pursuit of prices should be reduced.
| Ranking | Code | Name | Sector/Industry | RPS 50 | RPS 90 | RPS 120 | RPS 250 | RPS 20 | Today's Change |
|---|---|---|---|---|---|---|---|---|---|
| 1 | 3909.T | Showcase | Information and Communication Industry | 100.0 | 100.0 | 100.0 | 98.0 | 3.8 | -6.58% |
| 2 | 3042.T | Secure Vale | Information and Communication Industry | 100.0 | 99.9 | 99.9 | 99.2 | 58.3 | +14.64% |
| 3 | 5029.T | Cirkrais | Information and Communication Industry | 100.0 | 100.0 | 100.0 | 98.2 | 100.0 | +0.15% |
| 4 | 6191.T | Airtri | Services | 99.9 | 99.6 | 99.2 | 97.5 | 93.6 | +0.38% |
| 5 | 7360.T | Ondeck | Services | 99.9 | 99.7 | 99.3 | 91.4 | 92.7 | -1.00% |
| 6 | 4588.T | Oncolys BioPharma | Pharmaceuticals | 99.9 | 99.9 | 99.8 | 100.0 | 99.8 | +4.33% |
| 7 | 9246.T | Project Holdings | Services | 99.8 | 99.8 | 99.7 | 97.0 | 66.7 | 0.00% |
| 8 | 6533.T | Orchestra Holdings | Services | 99.8 | 99.5 | 99.7 | 99.7 | 38.7 | -0.64% |
| 9 | 4417.T | Global Security Expert | Information and Communication Industry | 99.8 | 99.7 | 99.9 | 99.5 | 96.6 | 0.00% |
| 10 | 7552.T | Happinet | Wholesale | 99.8 | 99.8 | 99.9 | 99.1 | 99.1 | -1.00% |
| 11 | 153A.T | Cowris | Information and Communication Industry | 99.7 | 99.5 | 87.7 | 81.6 | 97.8 | +12.82% |
| 12 | 4178.T | Sharing Innovations | Information and Communication Industry | 99.7 | 99.5 | 98.9 | 87.4 | 38.3 | -0.11% |
| 13 | 4933.T | I-ne | Chemicals | 99.7 | 99.7 | 99.5 | 98.7 | 95.8 | +1.29% |
| 14 | 4616.T | Kawakami Paint | Chemicals | 99.7 | 99.8 | 99.8 | 97.4 | 64.5 | -3.03% |
| 15 | 6989.T | 北陸電気工業 | Electrical Machinery | 99.6 | 97.7 | 98.7 | 97.3 | 100.0 | 0.00% |
| 16 | 1853.T | Mori Group | Construction | 99.6 | 99.2 | 99.0 | 95.7 | 99.9 | 0.00% |
| 17 | 3297.T | Tobu Sumisho Holdings | Real Estate Industry | 99.6 | 99.4 | 97.0 | 96.8 | 74.3 | -0.05% |
| 18 | 6262.T | PEGASUS | Machinery | 99.5 | 98.8 | 96.5 | 32.4 | 99.9 | +0.34% |
| 19 | 4918.T | Ivy Cosmetics | Chemicals | 99.5 | 97.3 | 99.2 | 91.8 | 99.9 | -2.90% |
| 20 | 6391.T | 加地テック | Machinery | 99.5 | 99.4 | 99.2 | 99.3 | 99.8 | 0.00% |
Referenceable Research Conclusions (2026-11-17 Data Snapshot)
The following conclusions are automatically generated by this database at 2026-11-17, with statistical objects being individual stocks in each market that currently have effective RPS 50 values. All proportions are current cross-sectional statistics and do not contain future return predictions.
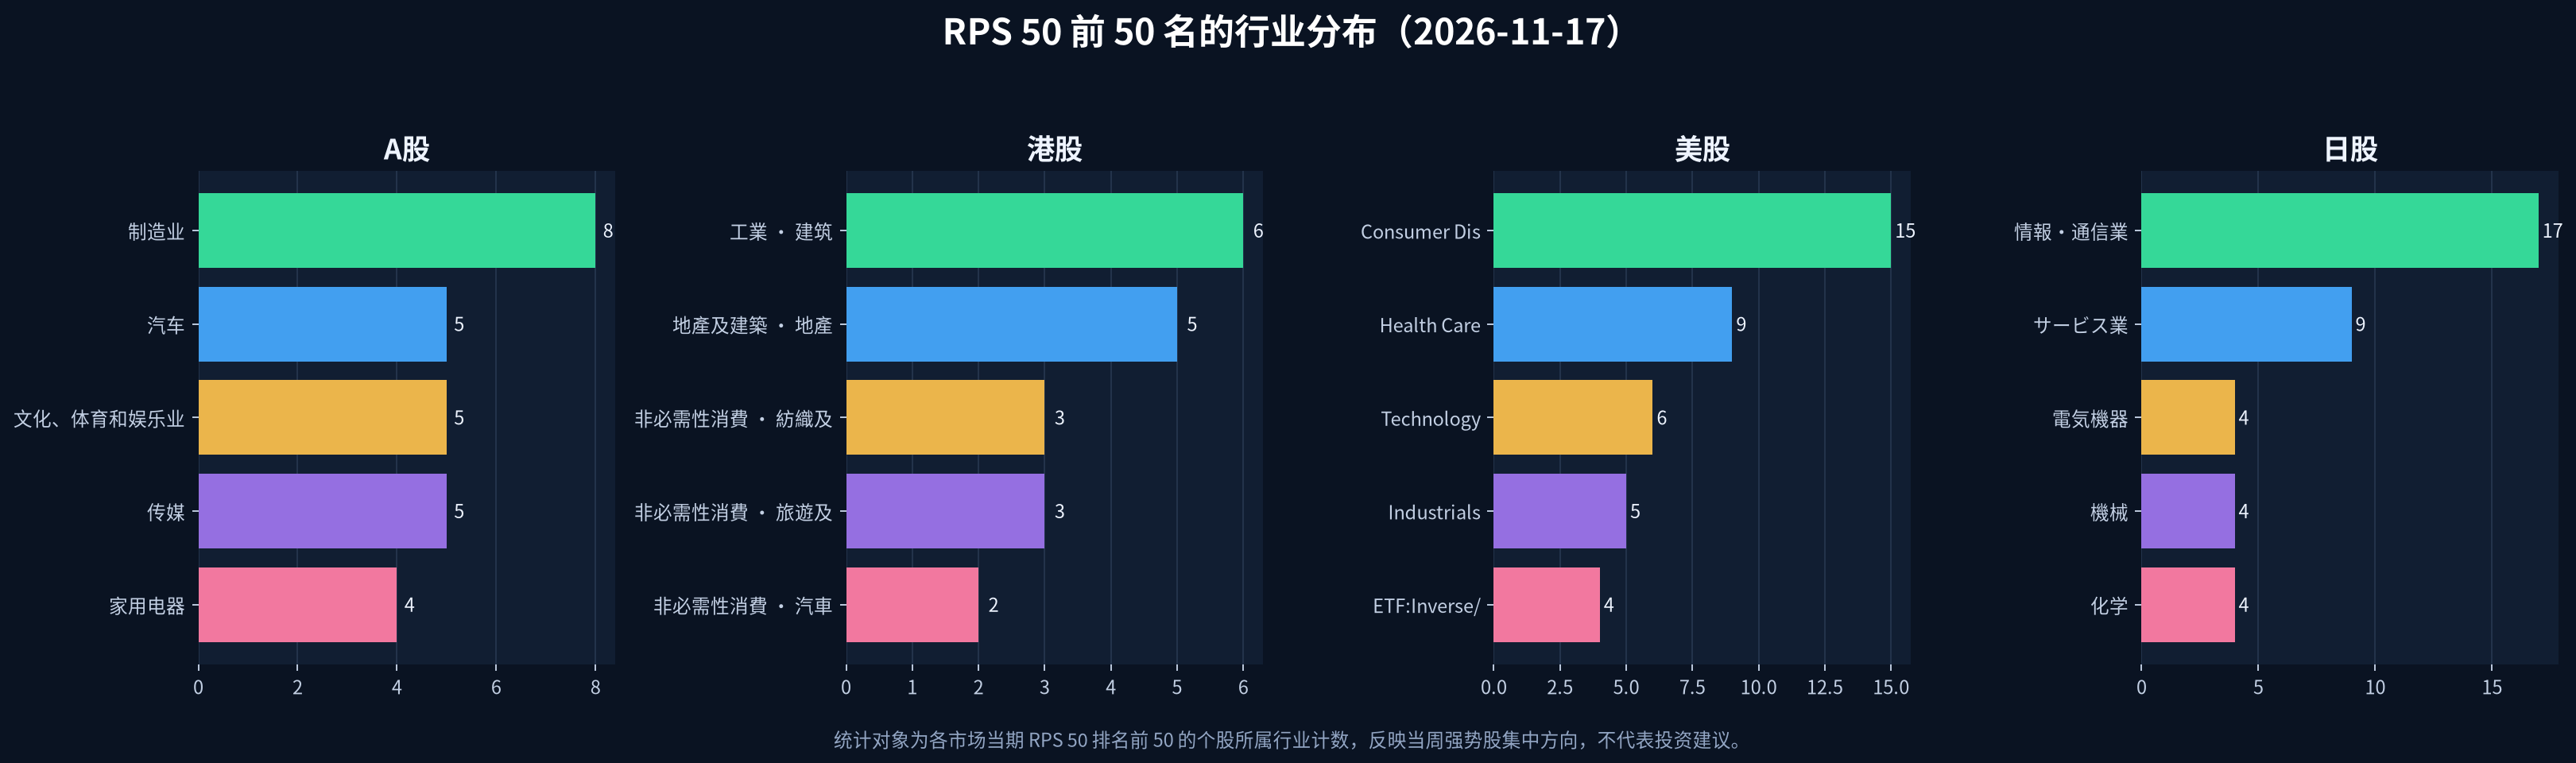
- China A-shares: Current effective samples are 5,212, among which the individual stocks with RPS 50 ≥ 90 are 523 (accounting for 10.0%); the most common industry in the top 50 is Manufacturing (8).
- Hong Kong stocks: Current effective samples are 2,760, among which the individual stocks with RPS 50 ≥ 90 are 277 (accounting for 10.0%); the most common industry in the top 50 is Industrial · Construction (6).
- US stocks: Current effective samples are 9,015, among which the individual stocks with RPS 50 ≥ 90 are 902 (accounting for 10.0%); the most common industry in the top 50 is Consumer Discretionary (15).
- Japan stocksCurrent effective sample: 3,681 stocks, among which there are 369 stocks with RPS 50 ≥ 90 (accounting for 10.0%); the most common industry in the top 50 is Information and Communications Industry (17 stocks).
| Market | Valid sample | RPS 50 ≥ 90 | RPS 50 ≥ 80 | Leading industry in the top 50 names |
|---|---|---|---|---|
| China A-shares | 5,212 | 523(10.0%) | 1,043 | Manufacturing (8 stocks) |
| Hong Kong stocks | 2,760 | 277(10.0%) | 553 | Industrial · Construction (6 stocks) |
| US stocks | 9,015 | 902(10.0%) | 1,808 | Consumer Discretionary (15 stocks) |
| Japan stocks | 3,681 | 369(10.0%) | 737 | Information and Communication Industry (17) |
Data range and stock pool, please refer to Cross-market data coverage archive; Indicator scope and window definitions, please refer to RPS methodology; Statistical and editing processes, please refer to Research and editorial standardsWhen citing this page, please note the data snapshot date as 2026-11-17.
This report is automatically generated by the system, and the AI summary is based only on current data. RPS is a technical analysis ranking tool and does not constitute any investment advice; stock investment carries risk, and past performance does not represent future returns.