RPS 50 Strong-Stock Ranking Weekly Report
This report lists the current strong targets in the four markets based on RPS 50 (50 trading days relative price strength). RPS is a historical relative performance ranking within the market, does not predict future prices, and does not constitute investment advice.
A-shares - RPS Strong Stocks Top 20
From this week's RPS 50 list,The strong distribution of A-shares is mainly concentrated in manufacturing (4), pharmaceutical and biological (4), and mechanical equipment (3).Wuzhou Medical and Nearshore Protein are at the forefront.Shows that funds still prefer the direction of higher relative intensity.Until the trend is disrupted,Sustainably observe the diffusion of leading plates and step back;If the width shrinks,The rhythm of price calls should be reduced.
| Ranking | Code | Name | Sector/Industry | RPS 50 | RPS 90 | RPS 120 | RPS 250 | RPS 20 | Today's Price Change |
|---|---|---|---|---|---|---|---|---|---|
| 1 | 301234 | Wuzhou Medical | Pharmaceutical and Biotech | 100.0 | 100.0 | 99.8 | 98.1 | 93.2 | +0.49% |
| 2 | 688137 | Nearshore Protein | Pharmaceutical and Biotech | 100.0 | 99.9 | 99.6 | 98.6 | 99.3 | +1.96% |
| 3 | 002827 | Gaozheng Minbao | Basic Chemicals | 100.0 | 99.9 | 99.0 | 94.3 | 97.9 | -3.55% |
| 4 | 600127 | Jinjian Rice Industry | Manufacturing | 99.9 | 99.9 | 98.8 | 97.1 | 99.4 | -1.55% |
| 5 | 300862 | Blue Shield Optoelectronics | Machinery | 99.9 | 99.8 | 99.2 | 95.8 | 72.7 | -6.28% |
| 6 | 603221 | Aili Home Furnishing | Manufacturing | 99.9 | 99.9 | 99.6 | 97.4 | 83.8 | -5.78% |
| 7 | 601579 | Kuaiji Mountain | Manufacturing | 99.9 | 99.7 | 98.5 | 91.3 | 99.9 | +3.51% |
| 8 | 300010 | ST Dou Shen | Social Services | 99.9 | 99.3 | 46.5 | 15.5 | 99.8 | +1.33% |
| 9 | 688203 | Hai Zheng Raw Wood | Basic Chemicals | 99.8 | 98.7 | 98.0 | 88.3 | 99.8 | -5.10% |
| 10 | 605058 | Aohong Electronics | Manufacturing | 99.8 | 98.6 | 97.5 | 95.2 | 100.0 | +2.73% |
| 11 | 300951 | Bosuo Technology | Electronics | 99.8 | 99.8 | 99.4 | 96.7 | 95.5 | -3.14% |
| 12 | 600371 | Wanxiang Denong | Agriculture, Forestry, Animal Husbandry, and Fishery | 99.8 | 99.6 | 97.6 | 92.6 | 99.3 | -8.28% |
| 13 | 300192 | Cod education | Social Services | 99.8 | 96.8 | 91.4 | 84.7 | 99.2 | +10.28% |
| 14 | 688485 | Jiuzhou Yitui | Machinery | 99.8 | 99.6 | 99.9 | 100.0 | 98.3 | -6.31% |
| 15 | 301080 | Bepacess | Pharmaceutical and Biotech | 99.7 | 99.9 | 99.3 | 95.7 | 98.9 | -6.46% |
| 16 | 301122 | Adoption OF shares | Pharmaceutical and Biotech | 99.7 | 99.8 | 98.8 | 97.6 | 99.7 | +3.65% |
| 17 | 688296 | Heda Technology | Computers | 99.7 | 99.0 | 98.3 | 94.5 | 83.9 | -3.73% |
| 18 | 301251 | Wilgau | Electronics | 99.7 | 95.6 | 95.9 | 88.5 | 99.8 | -2.22% |
| 19 | 002667 | * ST Wellington | Machinery | 99.7 | 90.4 | 41.5 | 92.2 | 85.6 | -4.84% |
| 20 | 601086 | Guofang Group | Wholesale and Retail Trade | 99.6 | 99.2 | 96.8 | 80.3 | 100.0 | -9.99% |
Hong Kong stocks - RPS Strong Stocks Top 20
Looking at this week's RPS 50 ranking list, the strong distribution of HK stocks is mainly concentrated in Industrial · Construction (4 stocks), Real Estate and Construction · Property (3 stocks), and Industrial · Industrial Engineering (3 stocks).华夏文化科技 and 方圓生活服務 lead the forefront, showing that funds still prefer directions with relatively higher strength. Before the trend is disrupted, it is advisable to continuously monitor the diffusion and rebound support of leading sectors; if the breadth contracts, reduce the pace of buying on strength.
| Ranking | Code | Name | Sector/Industry | RPS 50 | RPS 90 | RPS 120 | RPS 250 | RPS 20 | Today's Price Change |
|---|---|---|---|---|---|---|---|---|---|
| 1 | 1566.HK | Huaxia Cultural Technology | Communication Services · Tourism and Leisure Facilities | 100.0 | 100.0 | 100.0 | 100.0 | 98.2 | -0.94% |
| 2 | 9978.HK | Fangyuan Living Services | Real Estate and Architecture · Real Estate | 100.0 | 99.9 | 100.0 | 99.9 | 99.8 | -6.81% |
| 3 | 8128.HK | China Hengyuanyuan Group | Industrial · Industrial Engineering | 99.9 | 99.7 | 99.4 | 98.0 | 100.0 | -5.00% |
| 4 | 1489.HK | No Chinese Name Provided (1489) | Industrial · Construction | 99.9 | 99.7 | 99.8 | 99.2 | 99.0 | -8.59% |
| 5 | 1793.HK | Weigong Holdings | Industrial · Construction | 99.9 | 99.9 | 99.8 | 99.7 | 99.7 | +23.44% |
| 6 | 1826.HK | Fengzhan Holdings | Industrial · Construction | 99.8 | 99.6 | 98.7 | 99.1 | 99.3 | +5.26% |
| 7 | 1449.HK | Lide Education | Essential Consumption · Support Services | 99.8 | 99.8 | 99.5 | 98.5 | 94.6 | +8.67% |
| 8 | 0804.HK | Dingstone Capital | Financial Services · Other Financial | 99.8 | 99.6 | 99.2 | 98.7 | 75.3 | +3.23% |
| 9 | 1710.HK | Zhifeng Industrial Electronics | Industrial · Industrial Engineering | 99.7 | 99.3 | 99.6 | 99.5 | 99.9 | -4.69% |
| 10 | 1046.HK | Banyuan Entertainment Culture | Communication Services · Media and Entertainment | 99.7 | 99.5 | 99.0 | 98.0 | 99.4 | -2.33% |
| 11 | 1536.HK | Yurong Group | Industrial · Industrial Engineering | 99.6 | 98.0 | 97.7 | 97.0 | 99.1 | -14.08% |
| 12 | 2515.HK | Tianjin Jianfa | Industrial · Construction | 99.6 | 99.7 | 99.3 | 99.4 | 99.6 | 0.00% |
| 13 | 0147.HK | International Business Settlement | Real Estate and Construction · Information Technology Equipment | 99.6 | 98.4 | 97.3 | 19.5 | 75.6 | +1.51% |
| 14 | 2738.HK | Huajin International Holdings | Raw Materials · General Metals and Minerals | 99.5 | 97.6 | 33.0 | 19.1 | 100.0 | -10.93% |
| 15 | 9968.HK | Hui Jing Holdings | Real Estate and Architecture · Real Estate | 99.5 | 99.3 | 99.2 | 98.5 | 99.7 | +21.36% |
| 16 | 1753.HK | Duiba | Communication Services · Media and Entertainment | 99.5 | 99.2 | 98.6 | 90.3 | 96.9 | +3.03% |
| 17 | 1580.HK | Omori Holdings | Raw Materials | 99.4 | 95.0 | 89.5 | 97.1 | 99.4 | -1.82% |
| 18 | 2048.HK | Ejiu Enterprise Holdings | Real Estate and Architecture · Real Estate | 99.4 | 90.8 | 75.1 | 33.5 | 99.6 | -4.35% |
| 19 | 1529.HK | Leshi International Holdings | Industrial · Industrial Transportation | 99.3 | 97.6 | 96.4 | 91.5 | 92.8 | +4.95% |
| 20 | 1548.HK | Jinsrui Biotechnology | Healthcare · pharmaceuticals and biotechnology | 99.3 | 99.0 | 98.7 | 95.0 | 92.4 | +8.05% |
US Stocks - RPS Strong Stocks Top 20
From this week's RPS 50 list,The strong distribution of US stocks is mainly concentrated in Consumer Discretionary (5), Health Care (5), and Finance (3).Cheche Group Inc., GT Biopharma,Inc. is at the forefront.Shows that funds still prefer the direction of higher relative intensity.Until the trend is disrupted,Sustainably observe the diffusion of leading plates and step back;If the width shrinks,The rhythm of price calls should be reduced.
| Ranking | Code | Name | Sector/Industry | RPS 50 | RPS 90 | RPS 120 | RPS 250 | RPS 20 | Today's Price Change |
|---|---|---|---|---|---|---|---|---|---|
| 1 | CCG | Cheche Group Inc. | Finance | 100.0 | 100.0 | 100.0 | 99.9 | 2.9 | -12.67% |
| 2 | GTBP | GT Biopharma, Inc. | Health Care | 100.0 | 100.0 | 100.0 | 99.9 | 100.0 | +0.88% |
| 3 | NFE | New Fortress Energy Inc. | Utilities | 100.0 | 99.9 | 100.0 | 98.5 | 100.0 | +11.80% |
| 4 | ALP | Alpha Compute Corp | Finance | 100.0 | 100.0 | 100.0 | 33.2 | 100.0 | -0.53% |
| 5 | SFWL | Shengfeng Development Limited | Industrials | 100.0 | 100.0 | 99.9 | 99.9 | 99.9 | +7.09% |
| 6 | CTSO | Cytosorbents Corporation | Health Care | 99.9 | 99.9 | 99.9 | 99.6 | 99.9 | +1.86% |
| 7 | IPDN | Professional Diversity Network, Inc. | Technology | 99.9 | 99.9 | 99.5 | 34.7 | 100.0 | +7.91% |
| 8 | TNMG | TNL Mediagene | Consumer Discretionary | 99.9 | 99.9 | 98.5 | 25.9 | 99.9 | -12.38% |
| 9 | CPOP | Pop Culture Group Co., Ltd | Consumer Discretionary | 99.9 | 97.1 | 95.7 | 5.9 | 100.0 | -7.13% |
| 10 | OPTT | Ocean Power Technologies, Inc. | Utilities | 99.9 | 99.8 | 99.7 | 99.3 | 99.9 | -3.83% |
| 11 | NRSN | NeuroSense Therapeutics Ltd. | Health Care | 99.9 | 99.9 | 99.9 | 99.7 | 100.0 | -6.08% |
| 12 | USDE | StablecoinX Inc. | Finance | 99.9 | 0.0 | 0.0 | 0.0 | 99.7 | +21.31% |
| 13 | BRTX | BioRestorative Therapies, Inc. | Health Care | 99.9 | 100.0 | 99.9 | 94.7 | 99.9 | +1.59% |
| 14 | WCT | Wellchange Holdings Company Limited | Technology | 99.8 | 99.7 | 99.3 | 9.9 | 99.9 | +2.32% |
| 15 | XHLD | TEN Holdings, Inc. | Consumer Discretionary | 99.8 | 99.9 | 99.9 | 98.6 | 99.2 | +1.97% |
| 16 | CYPH | Cypherpunk Technologies Inc. | Health Care | 99.8 | 99.8 | 99.7 | 99.9 | 99.7 | +0.98% |
| 17 | HXF | Mast HedgeIndex Managed Futures Strategy ETF | ETF | 99.8 | 99.7 | 99.4 | 0.0 | 99.8 | -0.27% |
| 18 | SVRN | SVRN, Inc. | Consumer Discretionary | 99.8 | 99.9 | 99.7 | 95.5 | 99.9 | +11.91% |
| 19 | TJGC | TJGC Group Limited | Consumer Discretionary | 99.8 | 99.8 | 99.9 | 99.6 | 99.8 | -6.95% |
| 20 | MRNX | Defiance Daily Target 2X Long MRNA ETF | ETF:Leveraged | 99.8 | 99.9 | 99.8 | 0.0 | 99.5 | +4.33% |
Japan Stocks - RPS Strong Stocks Top 20
From this week's RPS 50 list,The strong distribution of Japanese stocks is mainly concentrated in the intelligence and communication industry (5), the service industry (4), and the wholesale industry (3).Japan Dry Chemical and Sunny Side Up Group are at the forefront,Shows that funds still prefer the direction of higher relative intensity.Until the trend is disrupted,Sustainably observe the diffusion of leading plates and step back;If the width shrinks,The rhythm of price calls should be reduced.
| Ranking | Code | Name | Sector/Industry | RPS 50 | RPS 90 | RPS 120 | RPS 250 | RPS 20 | Today's Price Change |
|---|---|---|---|---|---|---|---|---|---|
| 1 | 1909.T | Nippon Dry Chemical | Machinery | 100.0 | 84.3 | 87.0 | 96.3 | 49.5 | 0.00% |
| 2 | 2180.T | Sunny Side Up Group | Services | 100.0 | 91.7 | 91.8 | 90.0 | 50.5 | 0.00% |
| 3 | 7426.T | Shan Da | Wholesale | 100.0 | 100.0 | 100.0 | 100.0 | 100.0 | -0.17% |
| 4 | 4052.T | Feature | Information and Communication Industry | 99.9 | 100.0 | 99.9 | 98.6 | 99.9 | -10.48% |
| 5 | 2737.T | Tomen Device | Wholesale | 99.9 | 100.0 | 100.0 | 99.8 | 99.1 | +9.39% |
| 6 | 6862.T | Minato Holdings | Electrical Machinery | 99.9 | 99.5 | 99.7 | 99.9 | 99.8 | +1.79% |
| 7 | 5242.T | Aizu | Information and Communication Industry | 99.8 | 99.8 | 99.3 | 86.2 | 96.2 | +0.61% |
| 8 | 4588.T | Oncolys BioPharma | Pharmaceuticals | 99.8 | 99.9 | 99.8 | 100.0 | 99.7 | +4.84% |
| 9 | 8995.T | Sei Construction Industrial | Real Estate Industry | 99.8 | 99.6 | 96.8 | 92.4 | 98.4 | +2.20% |
| 10 | 3787.T | Technomathematical | Information and Communication Industry | 99.8 | 99.2 | 74.7 | 64.6 | 100.0 | -0.15% |
| 11 | 3907.T | Silicon Studio | Information and Communication Industry | 99.7 | 99.8 | 99.9 | 96.4 | 97.7 | -2.07% |
| 12 | 4440.T | Vitz | Information and Communication Industry | 99.7 | 99.8 | 97.2 | 94.3 | 100.0 | -6.00% |
| 13 | 150A.T | JSH | Services | 99.7 | 99.7 | 99.3 | 93.3 | 90.6 | +0.38% |
| 14 | 3131.T | Shinden High Tech | Wholesale | 99.7 | 99.9 | 99.8 | 98.2 | 98.5 | +5.30% |
| 15 | 6027.T | Lawyer.com | Services | 99.6 | 99.2 | 97.8 | 81.6 | 96.2 | -3.58% |
| 16 | 6998.T | Japanese Tungsten | Electrical Machinery | 99.6 | 99.6 | 99.1 | 99.0 | 99.0 | +0.24% |
| 17 | 6570.T | Kyowa Corporation | Services | 99.6 | 99.9 | 99.9 | 98.7 | 4.8 | +0.53% |
| 18 | 6904.T | Harada Kogyo | Electrical Machinery | 99.5 | 99.3 | 98.4 | 94.3 | 99.7 | +18.16% |
| 19 | 4933.T | I-ne | Chemicals | 99.5 | 99.4 | 99.0 | 84.8 | 99.6 | -5.19% |
| 20 | 278A.T | Terra Drone | Precision Machinery | 99.5 | 98.1 | 100.0 | 99.7 | 99.3 | -0.75% |
Can cite study conclusions (2026-09-24 data snapshot)
The following conclusions are automatically generated by the database of this site in 2026-09-24.The statistical objects are individual stocks with valid RPS 50 values in each market in the current period.All ratios are current cross-sectional statistics.Future earnings forecasts are not included.
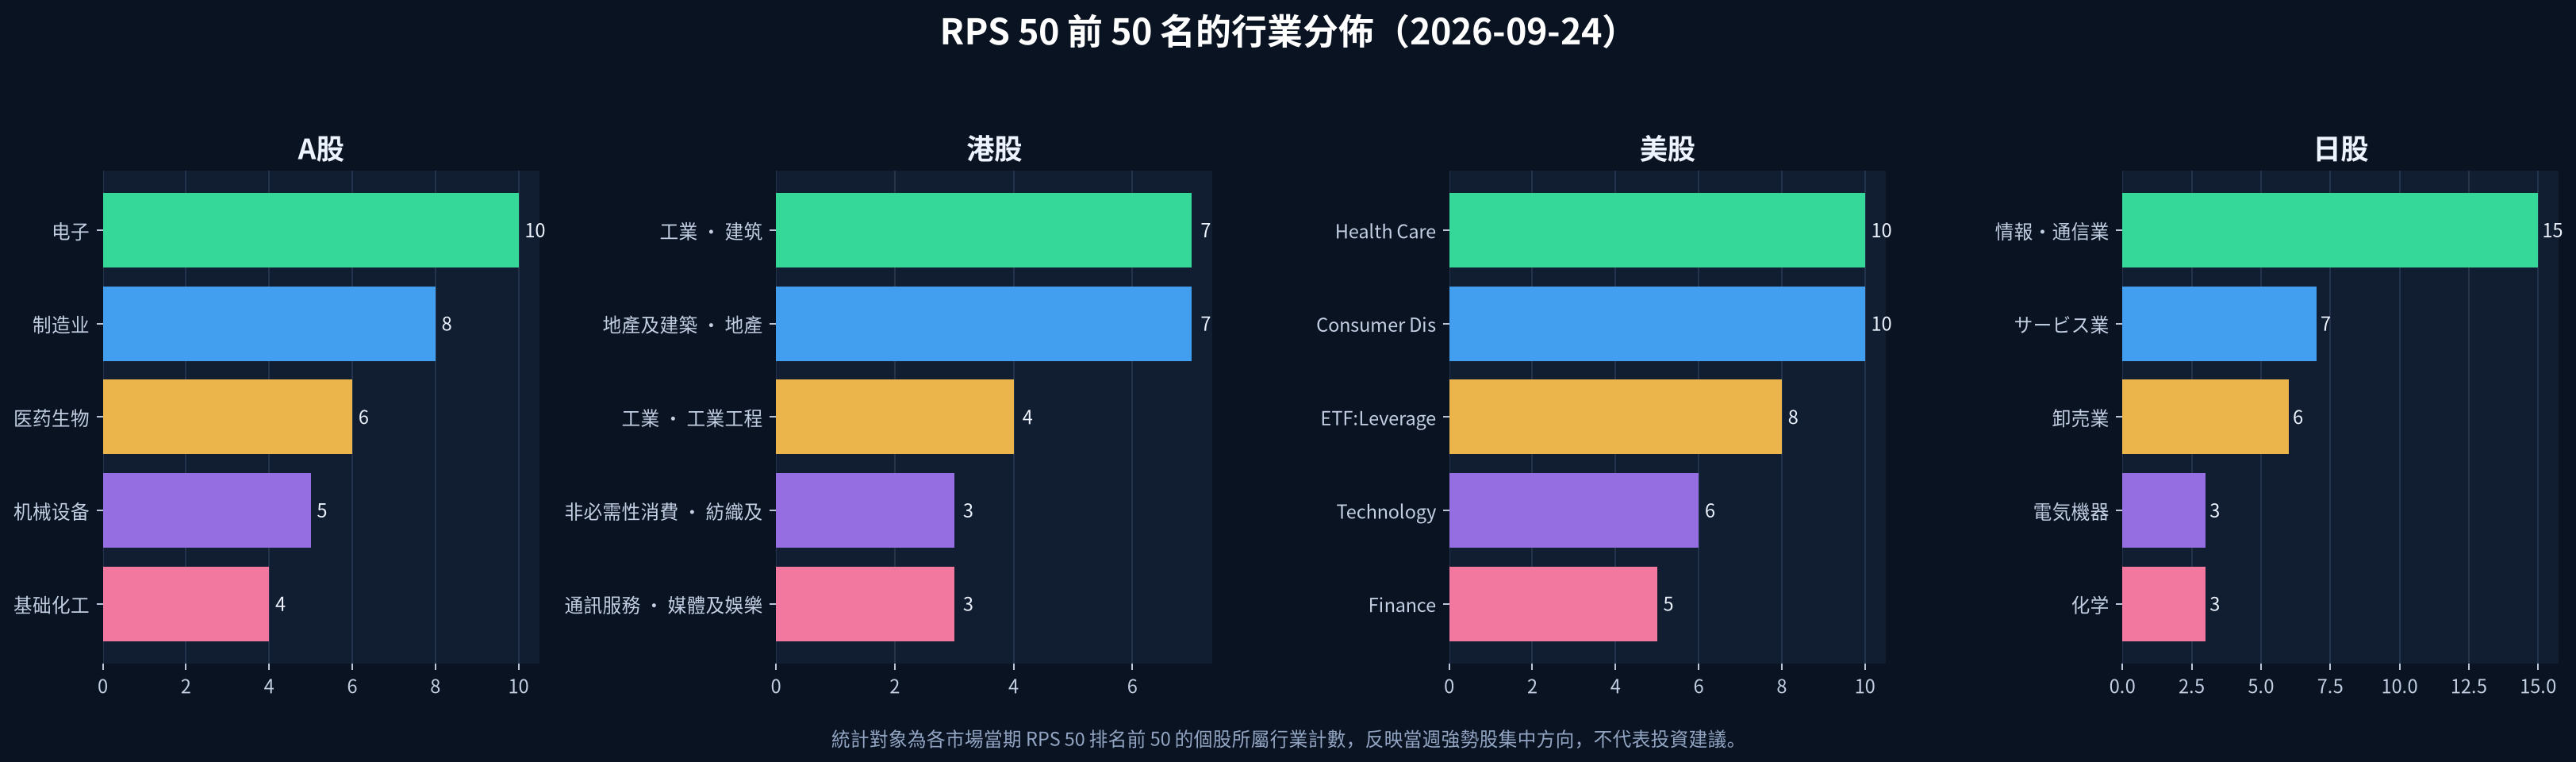
- China A-shares: Current valid sample 5,212 file,of which RPS 50 ≥ 90 523 (10.0%);The industry with the most appearances in the previous 50 name is electronics (10 file).
- Hong Kong stocks: Current valid sample 2,774 file,of which RPS 50 ≥ 90 278 (10.0%);The industry that appears the most in the previous 50 name is industrial and construction (7 file).
- US stocks: Current valid sample 8,956 file,of which RPS 50 ≥ 90 898 (10.0%);The industry with the most appearances in the top 50 name is Health Care (10 file).
- Japan stocks: Current valid sample 3,698 file,of which RPS 50 ≥ 90 370 (10.0%);The industry with the most appearances in the previous 50 name is the information and communication industry (15 file).
| Market | Effective Sample | RPS 50 ≥ 90 | RPS 50 ≥ 80 | Leading Industry in Top 50 Names |
|---|---|---|---|---|
| China A-shares | 5,212 | 523(10.0%) | 1,043 | Electronics (10 file) |
| Hong Kong stocks | 2,774 | 278(10.0%) | 555 | Industrial · Construction (7 stocks) |
| US stocks | 8,956 | 898(10.0%) | 1,796 | Health Care (File 10) |
| Japan stocks | 3,698 | 370(10.0%) | 741 | Information and communication industry (15 file) |
Please see the data range and stock pool Cross-market data coverage file; Please see the indicator definitions and window definitions RPS Methodology; Please see the statistical and editing process Research and Editing StandardsWhen citing this page, please note the data snapshot date 2026-09-24.
This report is automatically generated by the system, the AI summary is based only on current data. RPS is a technical analysis ranking tool, does not constitute any investment advice; stock investment has risk, past performance does not represent future returns.